The practical answer
An HPLC chromatogram plots detector response against time. Each peak is a component leaving the column at its retention time, and purity is the target peak's area as a percentage of all integrated peak areas, usually with UV detection at 210 to 220 nm. Check the wavelength, the peak table, which peaks were integrated, and whether identity was confirmed separately. A purity figure with no chromatogram, or with only a mass-filtered trace, is a number without its evidence. [1] [2] [3]
Evidence, method & source dates ↓What the picture is plotting
The horizontal axis is time since the sample was introduced to the column, usually in minutes. The vertical axis is detector response, for UV detection usually absorbance. As the sample passes through the column, each component leaves at a characteristic time, which GenScript calls the retention time. [1]
For peptides, the separation is usually reversed-phase on a C18 column, and the result is sensitive to the organic modifier and gradient used. [1] Retention time is therefore meaningful only under the stated method. A peak at 12.4 minutes on one laboratory's method says nothing about where it would appear on another's.
An annotated walkthrough
Work through the chromatogram page in this order. The right-hand column is what to check before you accept the purity figure.
| Element | What it means | What to check |
|---|---|---|
| Sample ID and lot | Which material was analysed | Matches the lot on your vial |
| Detection wavelength | Where the UV detector measured; peptide bonds absorb strongly around 210 to 220 nm [1] [2] | Stated; the same wavelength used for the purity calculation |
| Column and gradient | The separation conditions [1] | Stated, at least in summary |
| Main peak and retention time | The component believed to be the target peptide [1] | Identity confirmed separately, for example by mass spectrometry [1] [3] |
| Peak table | Retention time, area and area percent for each integrated peak | Present; areas add up to the stated total |
| Area percent of main peak | The purity figure: target area over total integrated area [1] [2] | Equals the purity on the certificate's summary |
| Baseline and integration marks | Where the software drew the baseline and peak limits | Small peaks near the main one are integrated, not skipped |
| Run length | How long the detector recorded | Long enough for late-eluting components to appear |
Integration decides the number
Because purity is the target peak's area divided by the total area of all integrated peaks, anything not integrated is not in the denominator. [1] [2] A shoulder merged into the main peak, a small peak below an integration threshold, or a run stopped before late components elute will all raise the reported purity without any change in the material.
That is why the peak table matters more than the headline. If the certificate shows a single integrated peak at 99.9 percent, look at the trace: are there visible bumps that were not counted? If the trace and table disagree, ask the laboratory for the integration parameters.
Two limits of any chromatogram
Co-elution. One peak can contain more than one component. The FDA-published ICH guidance on validating analytical procedures notes that peak purity tests, for example with a diode-array detector or mass spectrometry, may be useful to show that a peak is not attributable to more than one component. [3] A single symmetrical peak is consistent with purity; it does not prove it.
Detection limit. The same guidance treats a signal-to-noise ratio of 3:1 or 2:1 as generally acceptable for estimating the detection limit, and 10:1 as typical for the quantitation limit. [3] Impurities below those levels do not appear, so a clean baseline has a floor. That guidance is the 1996 text; check the current revision before citing numbers in a formal method.
Worked example: a mass-filtered trace is not a purity chromatogram
On 29 October 2026 we read a public certificate for tesamorelin 5 mg issued by BioRegen to Evolve Peptides. It states the method as qualitative and quantitative LC-MS with UV detection and reports 99.91 percent purity. [4]
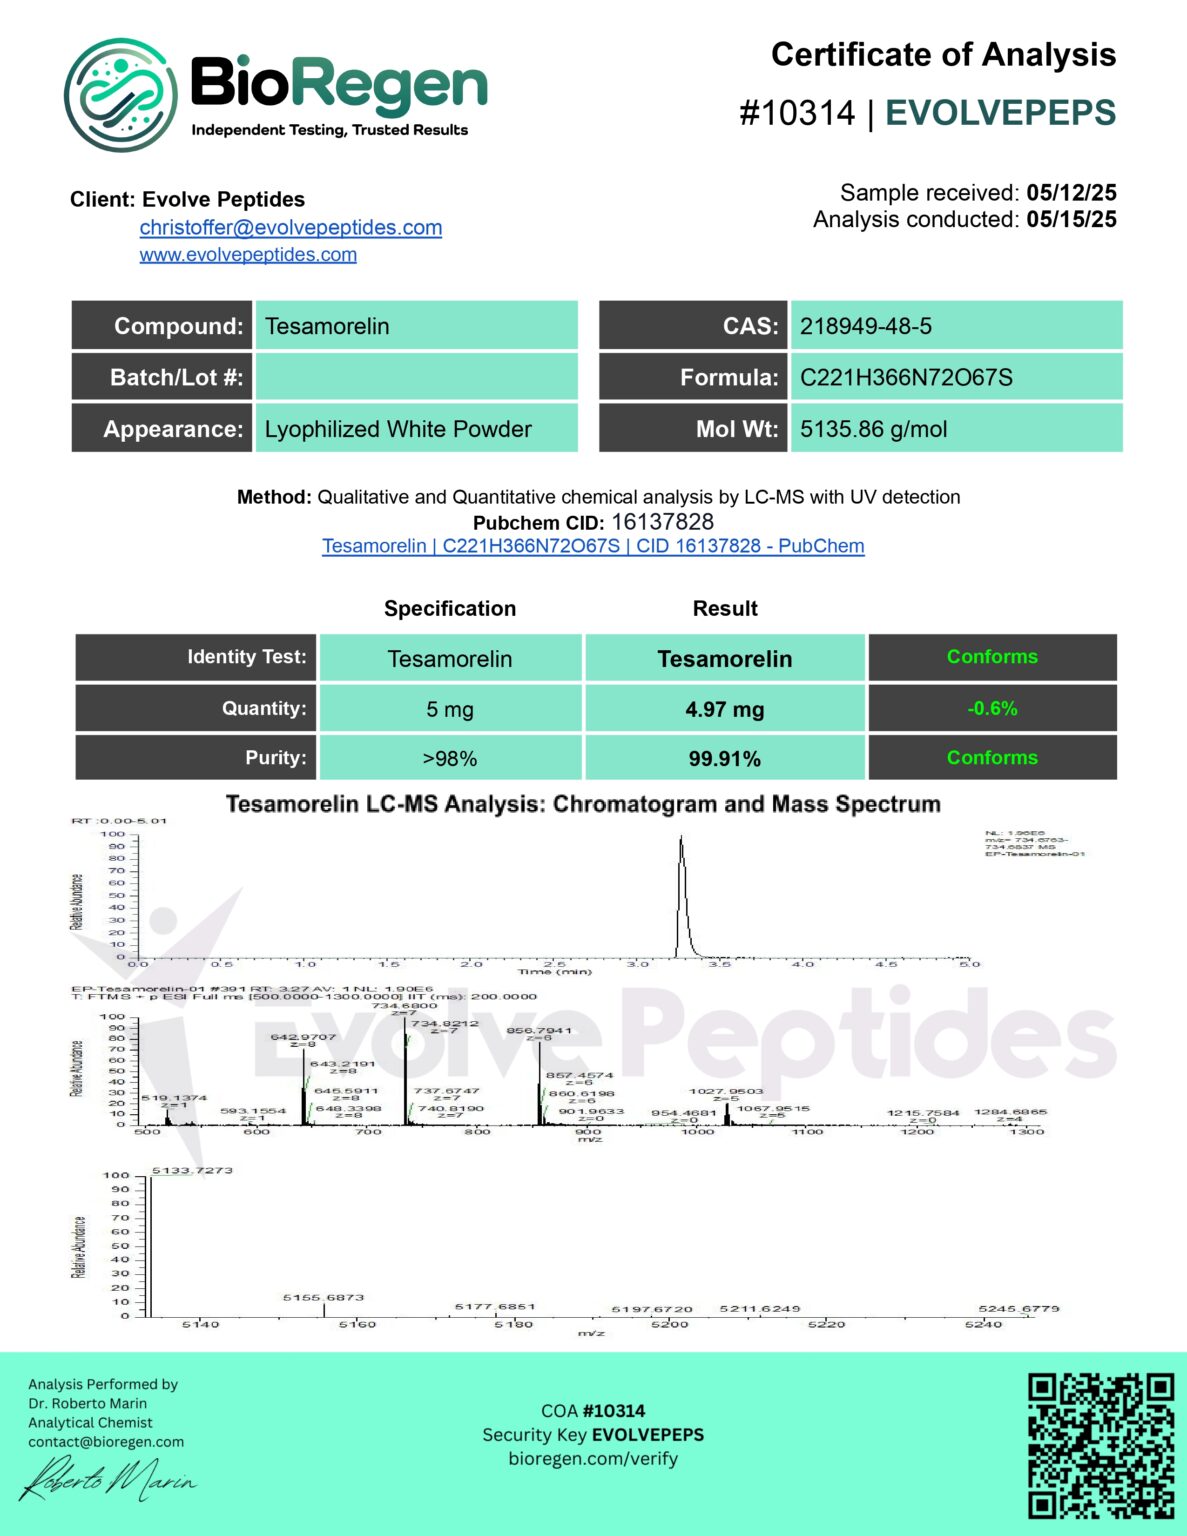
The chromatogram printed on it shows a single sharp peak at about 3.3 minutes. Its header reads "m/z= 734.6763-734.6837 MS", meaning the trace shows only ions in that narrow mass window. Our reading is that this is an extracted-ion trace: it confirms that a component with the target's expected mass elutes at that time, which supports identity. By construction, it cannot show impurities of other masses. [4]
So the UV trace and peak table behind the 99.91 percent figure are not on the page. The certificate's Batch/Lot field is also blank. [4] Record identity as supported by MS and purity as reported but not shown, and ask the laboratory for the UV chromatogram and peak table for the lot you will receive.
When the chromatogram is missing
The ICH guidance expects representative chromatograms, with individual components labelled, to demonstrate that a chromatographic method is specific. [3] A research-supplier certificate is not a regulatory filing, but the logic carries over: without the trace you cannot see what was integrated.
GenScript says it provides a certificate, MS and HPLC data for each peptide it makes, which shows that supplying the trace is routine for at least one large manufacturer. [1]
| What you have | How to record it | What to request |
|---|---|---|
| Purity number only | Purity reported, evidence not provided | UV chromatogram and peak table for this lot |
| Trace without peak table | Purity not reproducible from the document | Peak table with areas and retention times |
| Trace without wavelength or method | Conditions unknown | Wavelength, column and gradient summary |
| Mass-filtered trace only | Identity supported; purity not shown | UV trace used for the purity calculation |
| Trace for a different lot or size | Not applicable to your material | The trace for the lot you will receive |
A two-minute checklist
- Lot on the chromatogram matches your vial.
- Detection wavelength is stated, typically 210 to 220 nm for peptide purity. [1] [2]
- A peak table is present and its main-peak area percent equals the stated purity.
- Visible peaks near the main one are integrated.
- Identity is confirmed separately, for example by MS. [1]
- The trace is a UV trace if it is supporting a UV purity figure.
- Purity is not confused with net peptide content. [2]
Questions before you decide
What does retention time tell me?
When a component left the column under that method. It is useful for comparing runs on the same method, not across laboratories, and it does not identify a peptide by itself.
Why is HPLC purity reported as area percent?
The detector's response to each peak is integrated, and the target peak's area is divided by the total integrated area. It is a share of detected peaks, not a share of the vial's mass.
Is a single peak proof of purity?
No. Another component can co-elute under the same peak, and impurities below the detection limit do not appear. Peak purity checks, such as a diode-array detector or MS, add evidence.
Check the underlying evidence
Sources & review dates
- GenScript: Peptide quality control and analysis ↗Accessed 29 Oct 2026
- Bachem: Quality control of amino acids and peptides, a guide ↗Accessed 29 Oct 2026
- FDA: Guidance for Industry, Q2B Validation of Analytical Procedures: Methodology (ICH, November 1996) ↗Accessed 29 Oct 2026
- Evolve Peptides: tesamorelin 5 mg certificate of analysis image (BioRegen, COA 10314) ↗Accessed 29 Oct 2026
Sources are documentary evidence. They do not establish firsthand testing of a listed supplier.